Fig. 11
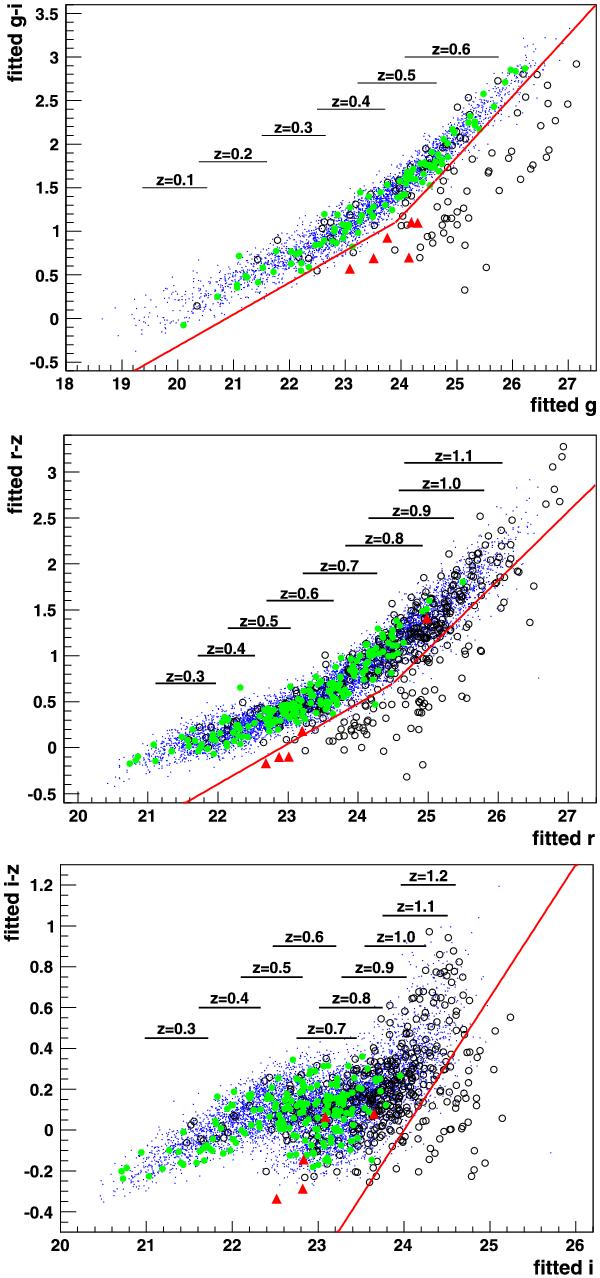
Colour–magnitude diagrams based on SALT2 fitted magnitudes for events that passed all previous constraints up to X1 and C cuts. Same colour code as in Fig. 9. Events below the lines were rejected. 1σ magnitude ranges are indicated for 0.1 redshift bins centred on the indicated redshift values (vertical locations of the segments are arbitrary).
Current usage metrics show cumulative count of Article Views (full-text article views including HTML views, PDF and ePub downloads, according to the available data) and Abstracts Views on Vision4Press platform.
Data correspond to usage on the plateform after 2015. The current usage metrics is available 48-96 hours after online publication and is updated daily on week days.
Initial download of the metrics may take a while.