Fig. 1
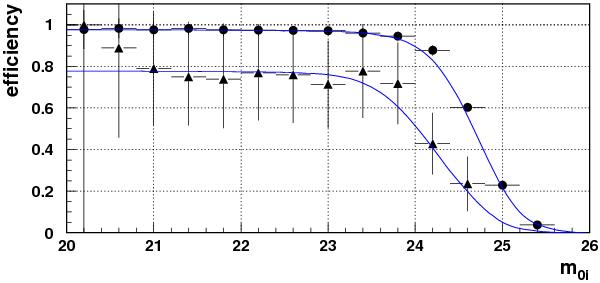
Detection efficiency ϵ(m0i) for the first season of D1 as a function of the generated peak magnitude in iM. The model (blue curve) is compared with Monte Carlo estimates (symbols), showing separately the efficiency for CCD 3 (triangles), or averaged over the rest of the mosaic (dots).
Current usage metrics show cumulative count of Article Views (full-text article views including HTML views, PDF and ePub downloads, according to the available data) and Abstracts Views on Vision4Press platform.
Data correspond to usage on the plateform after 2015. The current usage metrics is available 48-96 hours after online publication and is updated daily on week days.
Initial download of the metrics may take a while.