Fig. 9
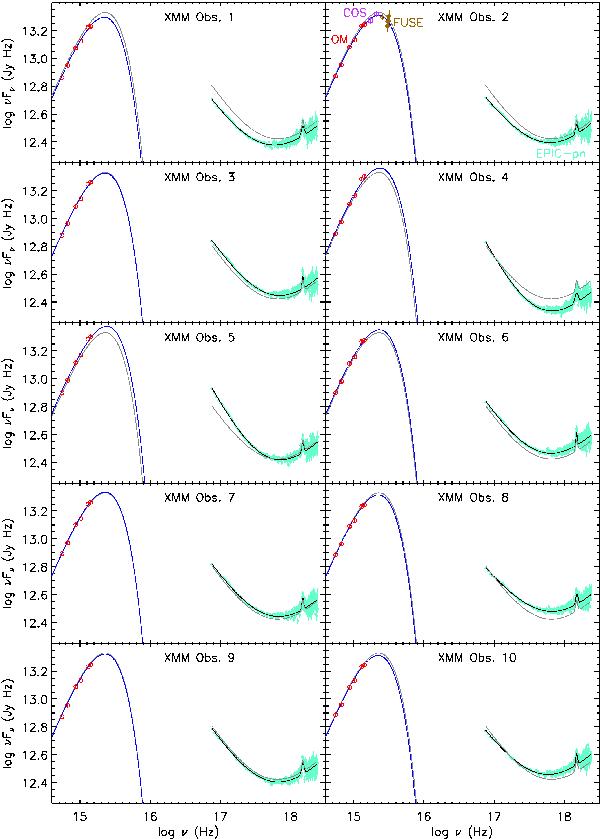
The best-fit model derived in Sect. 4 independently for the optical-UV and X-ray bands for each XMM-Newtonobservation. The absorption-corrected EPIC-pn data are show in green and the black lines are the two power-law model fits to the EPIC-pn including a Gaussian for modelling the Fe Kαline. The red circles represent the OM data and the blue lines are the disc blackbody models. In panel 2, the purple squares are the HST/COS data and the brown diamonds are the scaled FUSEdata. The average model obtained from the 10 XMM-Newtonobservations is shown in each panel (in grey) for reference to show the variability.
Current usage metrics show cumulative count of Article Views (full-text article views including HTML views, PDF and ePub downloads, according to the available data) and Abstracts Views on Vision4Press platform.
Data correspond to usage on the plateform after 2015. The current usage metrics is available 48-96 hours after online publication and is updated daily on week days.
Initial download of the metrics may take a while.