Fig. 3
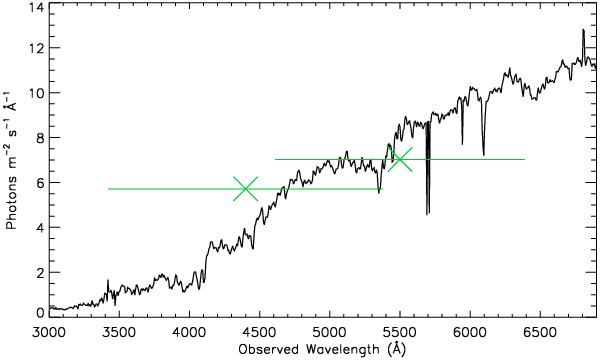
Calculated bulge stellar spectrum of Mrk 509 host galaxy shown in the range observed by the OM optical grism. The spectrum is obtained from the HSTmeasurement at rest wavelength of 5100 Å given in Bentz et al. (2009) and using the bulge model template of Kinney et al. (1996) to calculate the flux at other wavelengths. The two data points (green crosses) superimposed on the spectrum are the nuclear stellar flux for the standard B and V filters measured by Kotilainen & Ward (1994); the horizontal bars represent the filter bandpasses.
Current usage metrics show cumulative count of Article Views (full-text article views including HTML views, PDF and ePub downloads, according to the available data) and Abstracts Views on Vision4Press platform.
Data correspond to usage on the plateform after 2015. The current usage metrics is available 48-96 hours after online publication and is updated daily on week days.
Initial download of the metrics may take a while.