Fig. 12
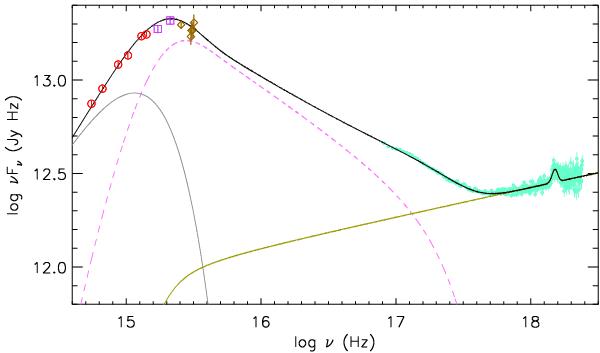
Best-fit broad-band model for XMM-NewtonObs. 2 as described in Sect. 5. The red circles represent the OM data, the purple squares the HST/COS data, the brown diamonds are the scaled FUSEdata and in green are the absorption-corrected EPIC-pn data. The grey line is the disc blackbody component, the dashed magenta is the warm Comptonisation component and the olive colour line represents the broken power-law and includes a Gaussian for modelling the Fe Kαline. The black line is the total model spectrum.
Current usage metrics show cumulative count of Article Views (full-text article views including HTML views, PDF and ePub downloads, according to the available data) and Abstracts Views on Vision4Press platform.
Data correspond to usage on the plateform after 2015. The current usage metrics is available 48-96 hours after online publication and is updated daily on week days.
Initial download of the metrics may take a while.