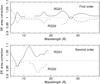
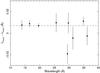
Fig. 5
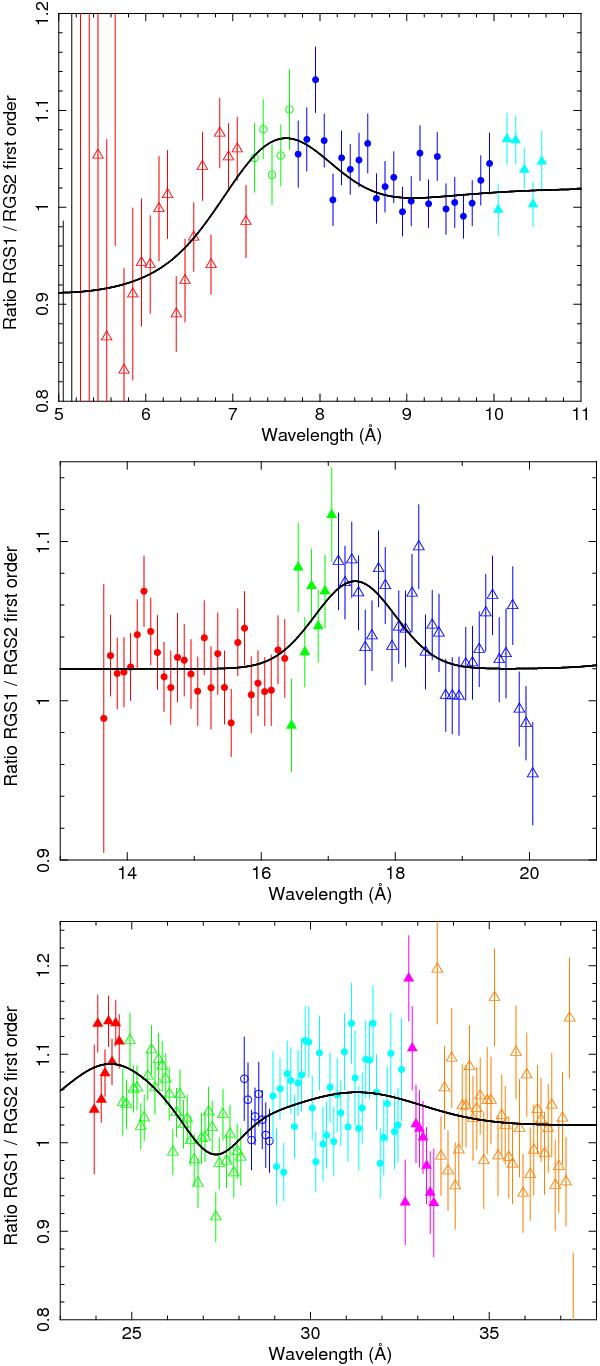
Flux ratio between RGS1 and RGS2 for parts of the spectrum that are detected by both RGS. Different symbols indicate different combinations of CCD chips for both RGS detectors. Open symbols: RGS1 chips 1, 3, 5, 9; filled symbols: RGS1 chips 2, 4, 6, 8. Triangles: RGS2 chips 1, 3, 5, 7, 9; circles: RGS2 chips 2, 6, 8. The solid line is a simple fit to the ratio’s using a constant plus Gaussians.
Current usage metrics show cumulative count of Article Views (full-text article views including HTML views, PDF and ePub downloads, according to the available data) and Abstracts Views on Vision4Press platform.
Data correspond to usage on the plateform after 2015. The current usage metrics is available 48-96 hours after online publication and is updated daily on week days.
Initial download of the metrics may take a while.