Fig. 2
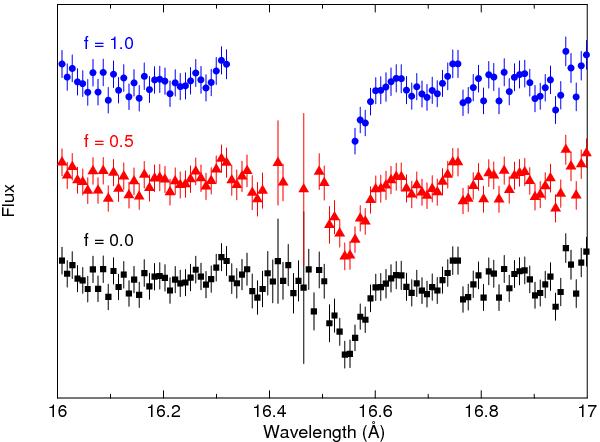
Spectral region near the gap between CCD 5 and 6 of RGS2, containing the 1s–3p line of O viii at 16.55 Å from the outflow. From top to bottom we show the fluxed spectra (arbitrarily scaled and shifted along the flux axis) for three values of f. Using the conservative setting f = 1, a major part of the spectrum is lost. With f = 0 no data are lost but of course between 16.3 and 16.55 Å the error bars are slightly larger because of the shorter exposure time in that wavelength region.
Current usage metrics show cumulative count of Article Views (full-text article views including HTML views, PDF and ePub downloads, according to the available data) and Abstracts Views on Vision4Press platform.
Data correspond to usage on the plateform after 2015. The current usage metrics is available 48-96 hours after online publication and is updated daily on week days.
Initial download of the metrics may take a while.