Free Access
Fig. 13
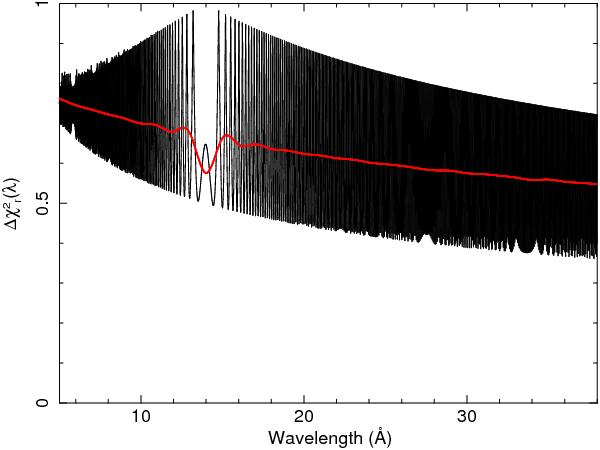
Relative contribution per wavelength bin to the reduced χ2. Calculated and shown is the ratio Var [Yi] /E [Yi] (see text). The thick line is a low-resolution spline approximation showing the trends in the average value.
Current usage metrics show cumulative count of Article Views (full-text article views including HTML views, PDF and ePub downloads, according to the available data) and Abstracts Views on Vision4Press platform.
Data correspond to usage on the plateform after 2015. The current usage metrics is available 48-96 hours after online publication and is updated daily on week days.
Initial download of the metrics may take a while.