Fig. 1
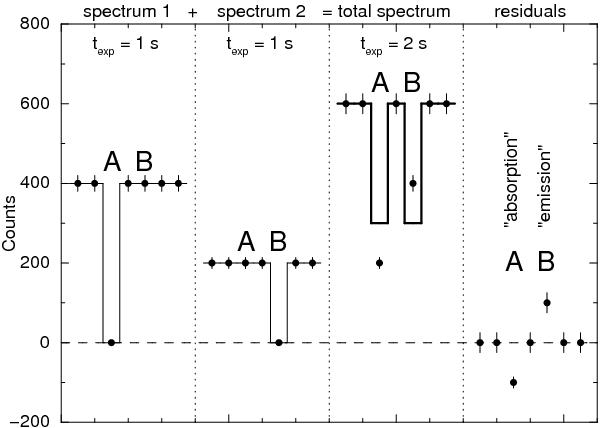
Illustration that spectra with different flux and different missing bins cannot be simply added. Both spectrum 1 and 2 have 1 s exposure but have different constant expected count rates of 400 and 200 counts s-1. In spectrum 1 pixel A is missing, in spectrum 2 pixel B. The thick solid line in the total spectrum indicates the predicted number of counts by straightforwardly adding the response matrices for both spectra with equal weights.
Current usage metrics show cumulative count of Article Views (full-text article views including HTML views, PDF and ePub downloads, according to the available data) and Abstracts Views on Vision4Press platform.
Data correspond to usage on the plateform after 2015. The current usage metrics is available 48-96 hours after online publication and is updated daily on week days.
Initial download of the metrics may take a while.