Free Access
Fig. 7
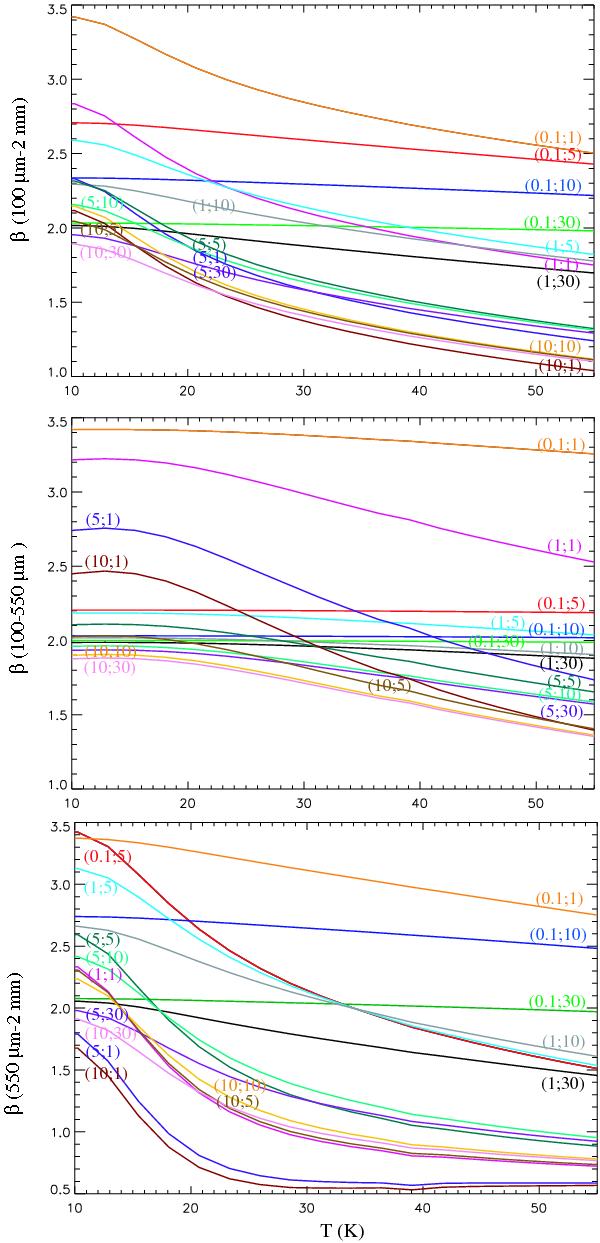
Prediction of the emissivity spectral index in the range [100 μm-2 mm] (top panel), [100–550 μm] (middle panel), [550 μm-2 mm] (bottom panel), deduced from the TLS model as a function of dust temperature, for different parameter couples [A, lc (nm)] assuming cΔ = 475.
Current usage metrics show cumulative count of Article Views (full-text article views including HTML views, PDF and ePub downloads, according to the available data) and Abstracts Views on Vision4Press platform.
Data correspond to usage on the plateform after 2015. The current usage metrics is available 48-96 hours after online publication and is updated daily on week days.
Initial download of the metrics may take a while.