Fig. 2
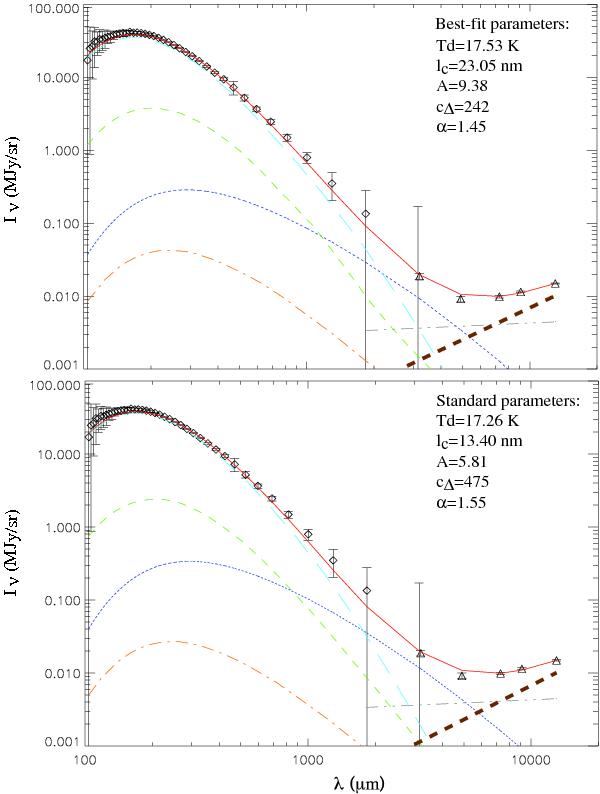
FIRAS/WMAP diffuse MW spectrum fitted using the TLS model: total in red (solid), DCD process in light blue (long dash), and TLS processes: resonant absorption in green (dash), hopping relaxation in dark blue (dot), and tunneling relaxation in orange (dash-dot), with the best-fit parameters (top panel) and standard parameters (bottom panel). The gray line (dash-dot-dot-dash) corresponds to free-free emission, and the brown line (thick dash) to a λα power law.
Current usage metrics show cumulative count of Article Views (full-text article views including HTML views, PDF and ePub downloads, according to the available data) and Abstracts Views on Vision4Press platform.
Data correspond to usage on the plateform after 2015. The current usage metrics is available 48-96 hours after online publication and is updated daily on week days.
Initial download of the metrics may take a while.