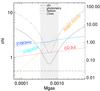
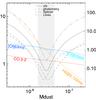
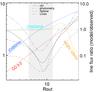
Fig. 9
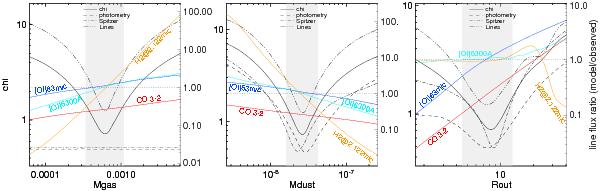
Systematic variation of single parameters around the values of the best-fitting disk model, showing the dependencies on total disk gas mass Mgas [M⊙] (l.h.s.), on total dust mass Mdust [M⊙] (middle) and on outer disk radius Rout [AU] (r.h.s.). The full black line shows the total χ, and the dotted, dashed and dashed-dotted lines show its constituents, χPhot, χSpit and χLine, see Eq. (3). The computed line flux ratios with respect to the observations Fline/Fobs (Fline/(3σ) for CO 3 → 2) are shown by the coloured lines as labelled, with tickmarks on the right axis). The grey shaded box marks the parameter-interval where χ is no more than twice its minimum.
Current usage metrics show cumulative count of Article Views (full-text article views including HTML views, PDF and ePub downloads, according to the available data) and Abstracts Views on Vision4Press platform.
Data correspond to usage on the plateform after 2015. The current usage metrics is available 48-96 hours after online publication and is updated daily on week days.
Initial download of the metrics may take a while.