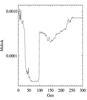
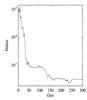
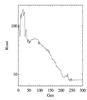
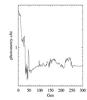
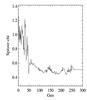
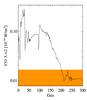
Fig. 8
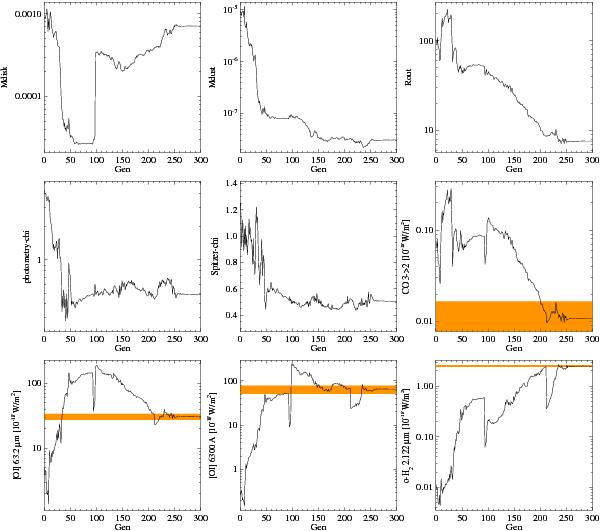
Auto-optimisation of model parameters to fit all continuum and line observations of ET Cha. The first row shows the evolution of some model parameters as function of generation (total gas mass Mgas [M⊙] , total dust mass Mdust [M⊙] , outer disk radius Rout [AU]). The two l.h.s. plots in the second row show the resulting χ for photometry and Spitzer spectrum. The other four plots shows the resulting line fluxes as labelled, where the orange bars indicate the observed line flux ranges with 1σ errors. At generation 94, the evolutionary strategy got stuck in an unsatisfactory solution (local minimum) with well-fitting SED, but very bad line fits χLine ≈ 5, i.e. a mean deviation between model and observed line fluxes of (e5 ≈ 150)σ. We have manually changed parameters at generation 95, increasing the disk mass by a factor 10. The evolutionary strategy then found a well-fitting model which can reproduce all available line and continuum observations within about 1σ on average.
Current usage metrics show cumulative count of Article Views (full-text article views including HTML views, PDF and ePub downloads, according to the available data) and Abstracts Views on Vision4Press platform.
Data correspond to usage on the plateform after 2015. The current usage metrics is available 48-96 hours after online publication and is updated daily on week days.
Initial download of the metrics may take a while.