Fig. 2
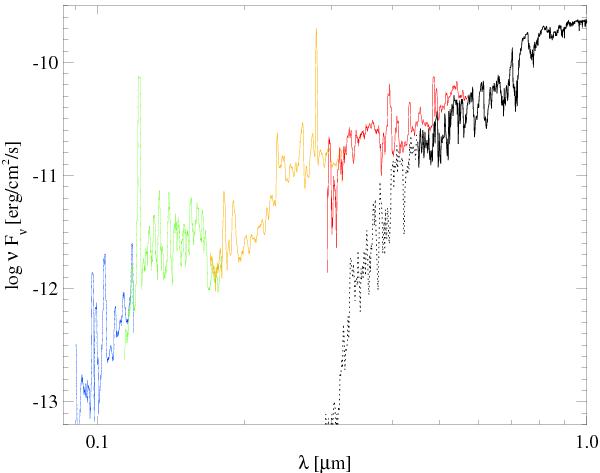
Observed UV spectra and the stellar atmosphere model spectrum for ET Cha (see Sect. 4.1). Blue: FUSE spectrum of TW Hya divided by 20. Green: HST/COS spectrum of ET Cha. Orange and red: G230L and G430L HST/STIS spectra of ET Cha. Black: stellar atmosphere model spectrum with Teff = 3400 K, log g = 3.89 and R⋆ = 0.84 R⊙, at a distance of 97 pc, plotted as dotted line (unused) for λ < 450 nm.
Current usage metrics show cumulative count of Article Views (full-text article views including HTML views, PDF and ePub downloads, according to the available data) and Abstracts Views on Vision4Press platform.
Data correspond to usage on the plateform after 2015. The current usage metrics is available 48-96 hours after online publication and is updated daily on week days.
Initial download of the metrics may take a while.