Fig. C.4
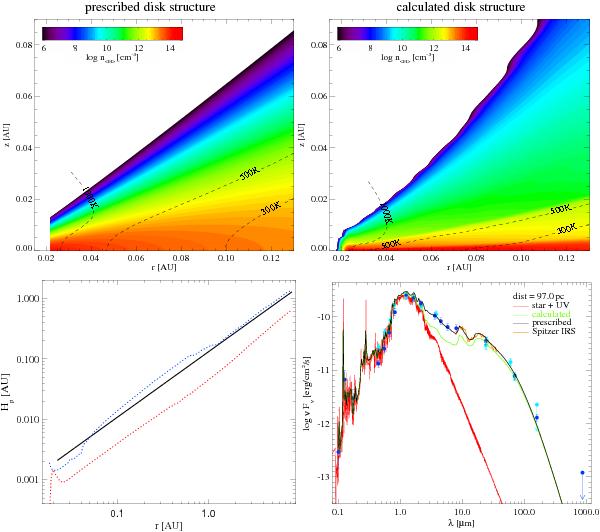
Density structure of inner rim and impact on SED. The upper left plot shows the prescribed density structure of our best-fitting model. Dashed contour lines in the upper panel refer to the calculated dust temperatures. The upper right plot represents a model with identical parameters where, however, the vertical disk structure is calculated consistently with the resultant gas temperatures and mean molecular weights, which results in a flatter midplane close to the star and too little near-mid IR excess (lower right plot). Note the “soft inner edge” (see Woitke et al. 2009). The lower left plot compares the prescribed scale height of the best-fitting model (full line) with the scale heights resulting from the model with calculated vertical disk stratification. The red dotted line shows these results in a deeper layer at z/r = 0.05, and the blue dotted line at z/r = 0.5.
Current usage metrics show cumulative count of Article Views (full-text article views including HTML views, PDF and ePub downloads, according to the available data) and Abstracts Views on Vision4Press platform.
Data correspond to usage on the plateform after 2015. The current usage metrics is available 48-96 hours after online publication and is updated daily on week days.
Initial download of the metrics may take a while.