Fig. 11
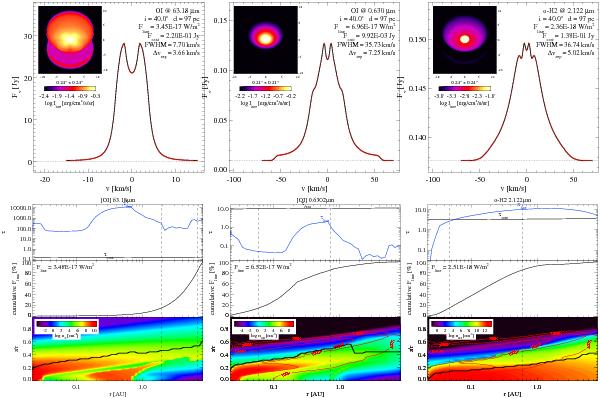
Line profiles, intensity maps, and spatial origin of some emission lines according to the best-fitting disk model. The upper row of figures shows the calculated continuum level, line profile, and continuum-subtracted frequency-integrated line intensity-map for [OI] 63.2 μm (left), [OI] 6300 Å (middle) and o-H2v = 1 → 0 S(1) 2.122 μm (right), based on formal line transfer solutions at inclination = 40°. Note the different scaling of velocity axis for the different lines. The lower row of figures visualises the vertical line and continuum optical depths as function of radius, the cumulative line flux, and the species density [cm-3] . The vertical dashed lines indicate where the line flux is coming from, bracketing 70% of the cummulative line flux in radius. The thick black lines in the lowest boxes mark those grid cells that contribute most to the vertical line flux; they mark the geometrical depth of the line formation region. For the analysis figures in the lower row, we have directly applied the upwards escape probability formalism (without formal solutions of line transfer). These analyses are hence only approximate in nature and valid for strictly upward line propagation only (inclination = 0°). The line fluxes calculated in this way deviate from the proper results under 40° by less than 8%.
Current usage metrics show cumulative count of Article Views (full-text article views including HTML views, PDF and ePub downloads, according to the available data) and Abstracts Views on Vision4Press platform.
Data correspond to usage on the plateform after 2015. The current usage metrics is available 48-96 hours after online publication and is updated daily on week days.
Initial download of the metrics may take a while.