Fig. 9
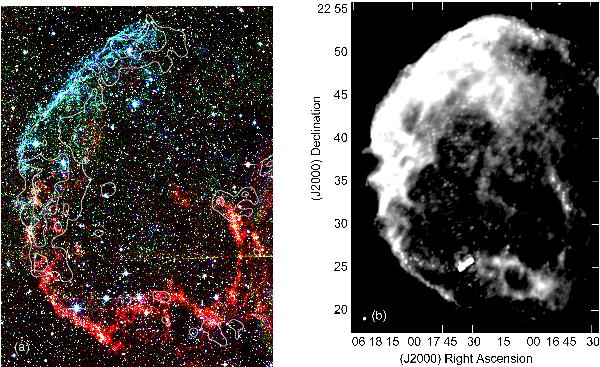
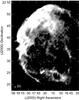
a) A color representation of the near-infrared emission observed with 2MASS in the J (in blue), H (in green), and Ks (in red) bands (Rho et al. 2001). The overlaid contours trace the flattest-spectrum radio structures of the SNR IC443 between 74 and 330 MHz at  and − 0.25. b) 330 MHz image of IC 443 showing the locations of the brightest regions of the remnant.

Current usage metrics show cumulative count of Article Views (full-text article views including HTML views, PDF and ePub downloads, according to the available data) and Abstracts Views on Vision4Press platform.
Data correspond to usage on the plateform after 2015. The current usage metrics is available 48-96 hours after online publication and is updated daily on week days.
Initial download of the metrics may take a while.