Fig. 6
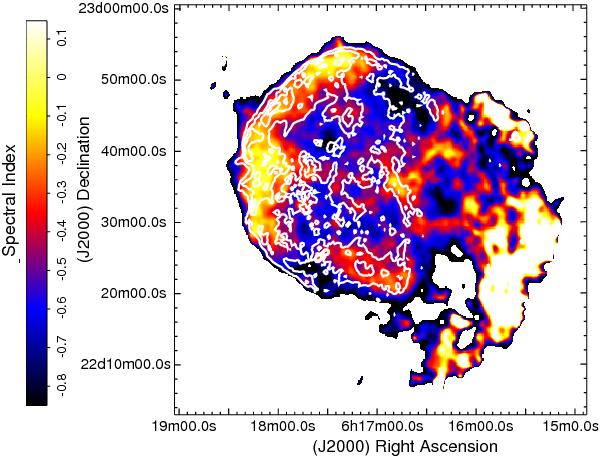
Spectral index map constructed using VLA observations at 74 and 330 MHz (matched to a common angular resolution of 70′′). The 5.5, 15, 26, and 40 mJy beam-1 contours from the 330 MHz image are included to facilitate the comparison between spectral continuum and total power features. To create this map the 74 and 330 MHz images were masked at 3σ.

Current usage metrics show cumulative count of Article Views (full-text article views including HTML views, PDF and ePub downloads, according to the available data) and Abstracts Views on Vision4Press platform.
Data correspond to usage on the plateform after 2015. The current usage metrics is available 48-96 hours after online publication and is updated daily on week days.
Initial download of the metrics may take a while.