Fig. 12
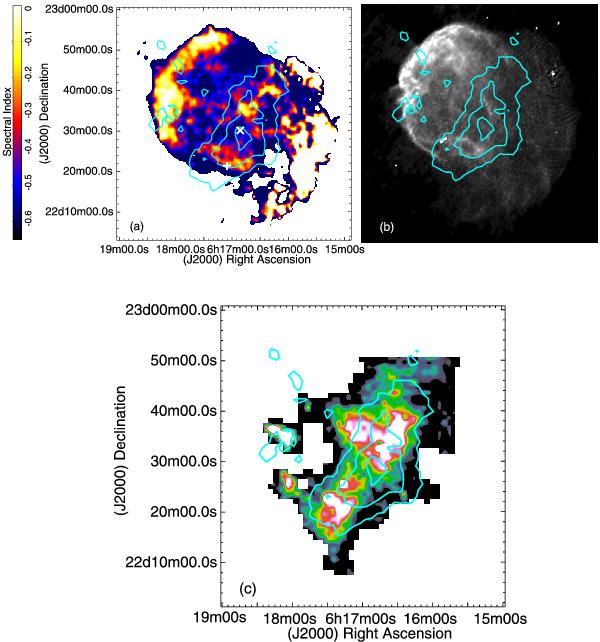
Very high energy gamma-rays contours as taken from VERITAS (Acciari et al. 2009) superposed with a) the 74/330 MHz spectral index map presented in Fig. 6, b) radio continuum emission at 330 MHz, and c) 12C0 (J = 1 − 0) integrated emission from − 10 to − 1 km s-1 tracing the molecular cloud interaction with IC 443 (Zhang et al. 2010). The white plus sign and the white cross in a) mark the positions of the source CXOU J061705.3+222127 and the centroid of the TeV source VER J0616.9+2230, respectively.
Current usage metrics show cumulative count of Article Views (full-text article views including HTML views, PDF and ePub downloads, according to the available data) and Abstracts Views on Vision4Press platform.
Data correspond to usage on the plateform after 2015. The current usage metrics is available 48-96 hours after online publication and is updated daily on week days.
Initial download of the metrics may take a while.