Fig. 11
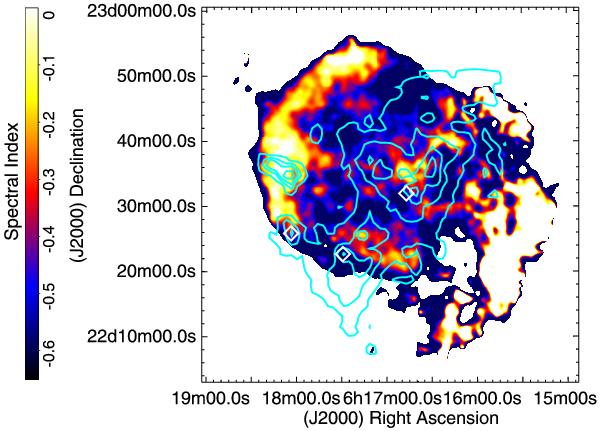
A comparison of the spectral index distribution with the molecular emission. The color representation corresponds to the spatially resolved spectral index map between 74 and 330 MHz, while the overlaid contours trace the 12C0 (J = 1 − 0) emission integrated between − 10 and − 1 km s-1 (Zhang et al. 2010). The positions where OH(1720 MHz) maser emission were detected are indicated with open white diamonds (Hoffman et al. 2003; Hewitt 2009).
Current usage metrics show cumulative count of Article Views (full-text article views including HTML views, PDF and ePub downloads, according to the available data) and Abstracts Views on Vision4Press platform.
Data correspond to usage on the plateform after 2015. The current usage metrics is available 48-96 hours after online publication and is updated daily on week days.
Initial download of the metrics may take a while.