Fig. 10
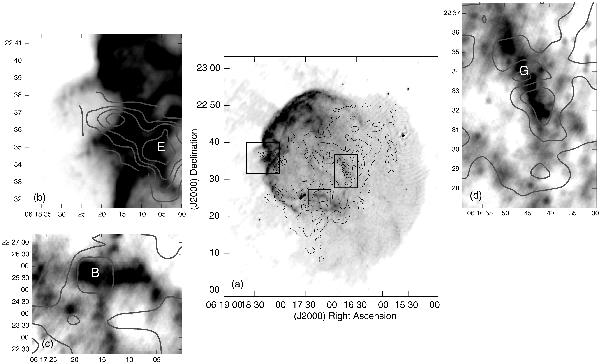
A comparison of the radio continuum emission of IC 443 and the 12CO (J = 1 − 0) distribution in the SNR region. The grayscale representation corresponds to the new VLA 330 MHz image, while the superposed contours trace CO integrated emission from − 10 to − 1 km s-1 as taken from Zhang et al. (2010). Close-ups of three interesting areas are displayed around the center image, with the CO contours overlapping. The white letter in each panel corresponds to the designation of the molecular clump by Dickman et al. (1992).
Current usage metrics show cumulative count of Article Views (full-text article views including HTML views, PDF and ePub downloads, according to the available data) and Abstracts Views on Vision4Press platform.
Data correspond to usage on the plateform after 2015. The current usage metrics is available 48-96 hours after online publication and is updated daily on week days.
Initial download of the metrics may take a while.