Fig. 9
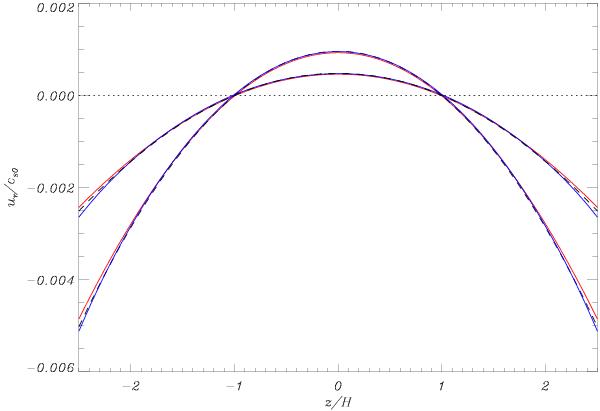
Vertical profile of the gas radial velocity obtained in two hydrodynamical viscous simulations with the Pencil code (red solid line) and with the JUPITER code (solid blue line). The two sets of curves plot the simulations results obtained with α = 5 × 10⁻³ and 10-2 while the dashed lines are the analytical predictions of Eq. (14). Numerical and analytical results are in excellent agreement with each other.
Current usage metrics show cumulative count of Article Views (full-text article views including HTML views, PDF and ePub downloads, according to the available data) and Abstracts Views on Vision4Press platform.
Data correspond to usage on the plateform after 2015. The current usage metrics is available 48-96 hours after online publication and is updated daily on week days.
Initial download of the metrics may take a while.