Fig. 5
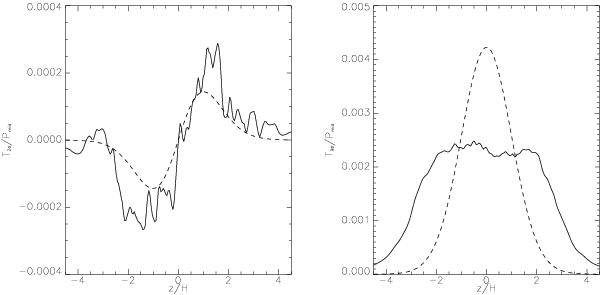
Left panel: vertical profile of  (solid line) and
  (dashed line), time averaged between t = 400 and t = 600 and radially averaged between R = 3 and R = 6. The two stresses are similar both in amplitude and in their vertical profile. Right panel: vertical profile of
  (solid line) and
  (dashed line), time averaged between t = 400 and t = 600 and radially averaged between R = 3 and R = 6. Although they are comparable in magnitude, the viscous and turbulent stresses display largely different vertical profiles.
Current usage metrics show cumulative count of Article Views (full-text article views including HTML views, PDF and ePub downloads, according to the available data) and Abstracts Views on Vision4Press platform.
Data correspond to usage on the plateform after 2015. The current usage metrics is available 48-96 hours after online publication and is updated daily on week days.
Initial download of the metrics may take a while.