Fig. 4
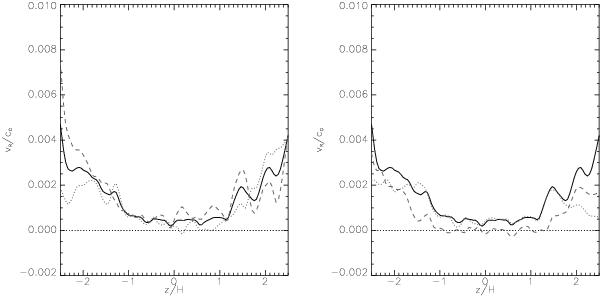
Vertical profile of the radial velocity for the case p = −2. In both panels, the solid line is identical to that plotted on the right panel of Fig. 3 (time average over [400,600] and radial average over [3,6] ). The left panel investigates the sensitivity of the result on the time average while keeping the same radial range: the time average is taken over [400,500] (dotted line) and [500,600] (dashed line). The right panel shows data obtained with the same time average, [400,600] , but different radial range, namely R ∈ [2,4.5] (dotted line) and R ∈ [4.5,7] (dashed line).
Current usage metrics show cumulative count of Article Views (full-text article views including HTML views, PDF and ePub downloads, according to the available data) and Abstracts Views on Vision4Press platform.
Data correspond to usage on the plateform after 2015. The current usage metrics is available 48-96 hours after online publication and is updated daily on week days.
Initial download of the metrics may take a while.