Fig. 3
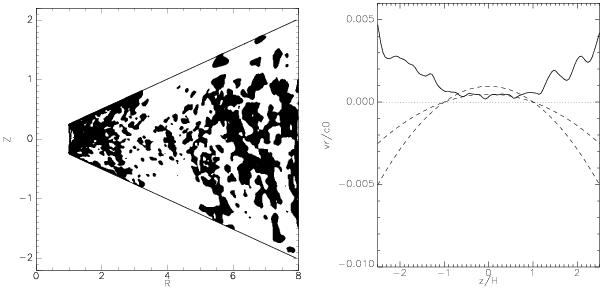
Left panel: time and azimuthally averaged radial velocity for the model p = −2. Positive velocities are marked with white colors, while black regions correspond to negative vR. The raw simulation data have been averaged in time between t = 400 and t = 600. Right panel: the solid line shows the vertical profile of the radial velocity averaged in time between t = 400 and t = 600, in the azimuthal direction and in the radial direction between R = 3 and R = 6. The dashed lines show the theoretical prediction of Eq. (14) for α = 10-2 and 5 × 10⁻³, respectively . The dotted line simply marks the zero point as a reference.
Current usage metrics show cumulative count of Article Views (full-text article views including HTML views, PDF and ePub downloads, according to the available data) and Abstracts Views on Vision4Press platform.
Data correspond to usage on the plateform after 2015. The current usage metrics is available 48-96 hours after online publication and is updated daily on week days.
Initial download of the metrics may take a while.