Fig. A.2
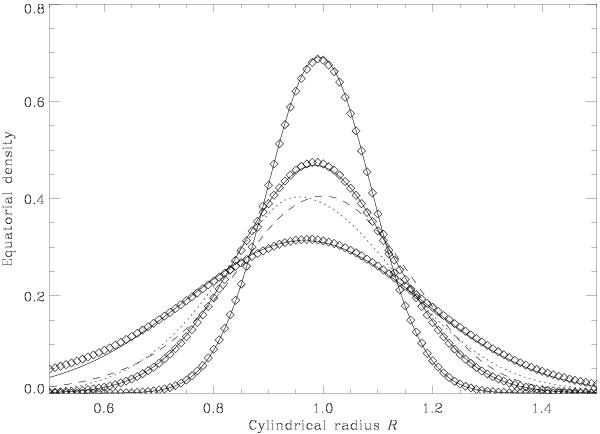
Equatorial density cuts for τ0 = 0.018 (initial conditions, highest and narrowest peak), τ0 = 0.04 and τ0 = 0.09 (widest distribution). In each case the diamond’s curve represents the distribution inferred in the Z = Z0 plane from the numerical simulations, using a bilinear interpolation, while the solid curve represents the exact solution of Lynden-Bell & Pringle (1974). In addition, the dotted and dashed curves represent the situation obtained for τ0 = 0.09 in numerical calculations in which we set  and
and  to zero, respectively.
Current usage metrics show cumulative count of Article Views (full-text article views including HTML views, PDF and ePub downloads, according to the available data) and Abstracts Views on Vision4Press platform.
Data correspond to usage on the plateform after 2015. The current usage metrics is available 48-96 hours after online publication and is updated daily on week days.
Initial download of the metrics may take a while.