Fig. 3
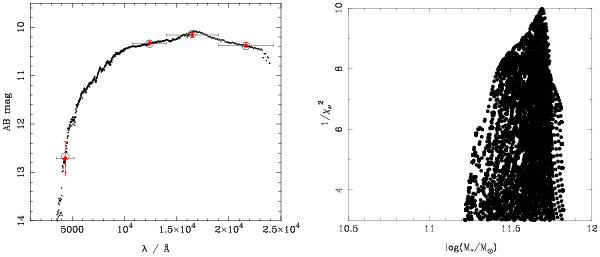
NGC 7052. Left: model fit to photometry (see color figure online). The best-fit spectral template is marked with points, the corresponding model magnitudes in the observed bands with circles. The observed magnitudes are indicated with filled red circles and error bars. The (black) bars in the wavelength direction denote the bandwidth of respective filters. Right: the likelihood of the stellar mass estimates.
Current usage metrics show cumulative count of Article Views (full-text article views including HTML views, PDF and ePub downloads, according to the available data) and Abstracts Views on Vision4Press platform.
Data correspond to usage on the plateform after 2015. The current usage metrics is available 48-96 hours after online publication and is updated daily on week days.
Initial download of the metrics may take a while.