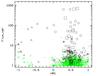
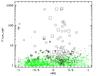
Fig. 9

Variability factor of sources from the XMM LP-total catalogue in the 0.2–4.5 keV band (derived from the average fluxes of the XMM-Newton EPIC observations) plotted versus HR1 in the left panel and HR2 in the right panel. For source classification see Fig. 8. Sources with a statistical significance of the variability below three are marked in green.
Current usage metrics show cumulative count of Article Views (full-text article views including HTML views, PDF and ePub downloads, according to the available data) and Abstracts Views on Vision4Press platform.
Data correspond to usage on the plateform after 2015. The current usage metrics is available 48-96 hours after online publication and is updated daily on week days.
Initial download of the metrics may take a while.