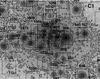
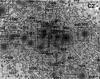
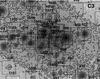
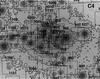
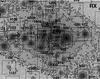
Fig. A.2

Inner area of M 31 enlarged from Fig. A.1. Contours are at (4,8,16,32,64,128,256) × 10-6 ct s-1 pix-1 including a factor of one smoothing. Sources from the large catalogue are marked as 30′′ × 30′′ squares. The images are ordered as follows: Centre 1 (upper left), Centre 2 (upper right), Centre 3 (middle left), Centre 4 (middle right) and Centre B (lower left).
Current usage metrics show cumulative count of Article Views (full-text article views including HTML views, PDF and ePub downloads, according to the available data) and Abstracts Views on Vision4Press platform.
Data correspond to usage on the plateform after 2015. The current usage metrics is available 48-96 hours after online publication and is updated daily on week days.
Initial download of the metrics may take a while.