Fig. 3
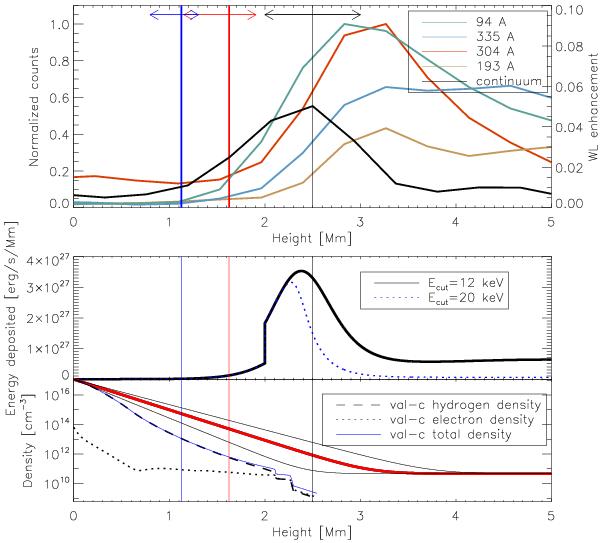
Top: height of HXR emission at the lowest (red vertical lines) and highest (blue vertical lines) imaged energies, EUV emission at different wavelengths (see legend), and WL relative enhancement where the black line indicates the height of maximum enhancement. Arrows indicate the corresponding uncertainties. Middle: energy deposition rate as a function of height for two different cases of electron cutoff energy. Bottom: fitted density model (thick solid line). The thin solid lines give the lower and higher limits of the density determined by the uncertainty in the fit of the scale height. The model from Vernazza et al. (1981) is given for comparison.
Current usage metrics show cumulative count of Article Views (full-text article views including HTML views, PDF and ePub downloads, according to the available data) and Abstracts Views on Vision4Press platform.
Data correspond to usage on the plateform after 2015. The current usage metrics is available 48-96 hours after online publication and is updated daily on week days.
Initial download of the metrics may take a while.