Fig. 2
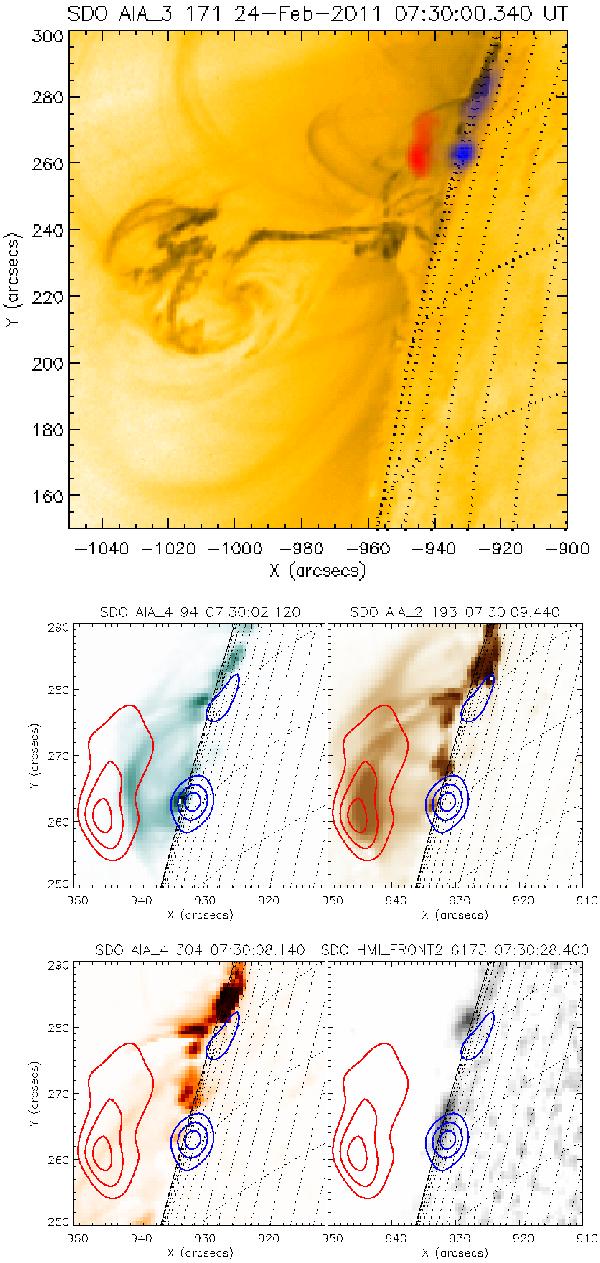
Top: RHESSI soft (red) and hard X-ray emission (blue) superimposed on AIA 171 Å image. Bottom: AIA difference images at three wavelengths and HMI image (bottom right). Contours at 50, 70 and 90% of the maximum emission in RHESSI CLEAN images between 07:30:00 and 07:30:40 UT at 6–12 keV (red) and 25–50 keV (blue) are overlaid. The temporal evolution is shown in the movies available in the on-line edition. RHESSI light-curves (cf. top panel of Fig. 1) were added to the animation of the bottom panel to provide a link between the total X-ray flux evolution and the corresponding images.
Current usage metrics show cumulative count of Article Views (full-text article views including HTML views, PDF and ePub downloads, according to the available data) and Abstracts Views on Vision4Press platform.
Data correspond to usage on the plateform after 2015. The current usage metrics is available 48-96 hours after online publication and is updated daily on week days.
Initial download of the metrics may take a while.