Free Access
Fig. 1
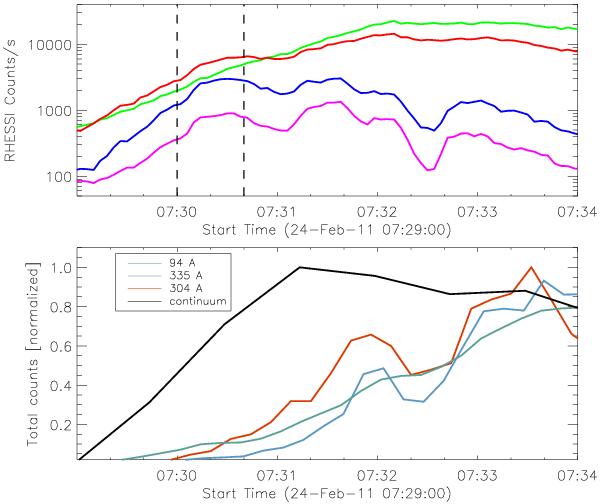
Top: RHESSI lightcurves of the main flare phase in different energy bands: 6–12 keV (green), 12–25 keV (red), 25–50 keV (blue), 50–100 keV (purple). Bottom: normalized AIA and HMI emission emanating from location of the southern HXR footpoint as function of time at several wavelengths (see legend).
Current usage metrics show cumulative count of Article Views (full-text article views including HTML views, PDF and ePub downloads, according to the available data) and Abstracts Views on Vision4Press platform.
Data correspond to usage on the plateform after 2015. The current usage metrics is available 48-96 hours after online publication and is updated daily on week days.
Initial download of the metrics may take a while.