Fig. 3
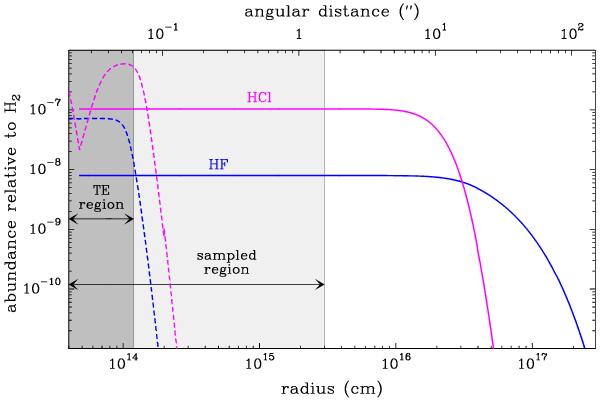
Abundances relative to H2 of HF and HCl (including H35Cl and H37Cl) as a function of radius in IRC +10216. Abundances plotted as solid lines have a constant value in the inner envelope, derived from a fit to the observed lines (see Figs. 1 and 2), and decrease in the outer envelope due to photodissociation, as computed with a photochemical model. The region of the envelope sampled by the observed lines of HF and HCl (see text) extends up to 3 × 1015 cm (light shaded region). Dashed lines correspond to abundances computed by thermochemical equilibrium, which only holds up to ~3 R ∗ (dark shaded region).
Current usage metrics show cumulative count of Article Views (full-text article views including HTML views, PDF and ePub downloads, according to the available data) and Abstracts Views on Vision4Press platform.
Data correspond to usage on the plateform after 2015. The current usage metrics is available 48-96 hours after online publication and is updated daily on week days.
Initial download of the metrics may take a while.