Fig. 1
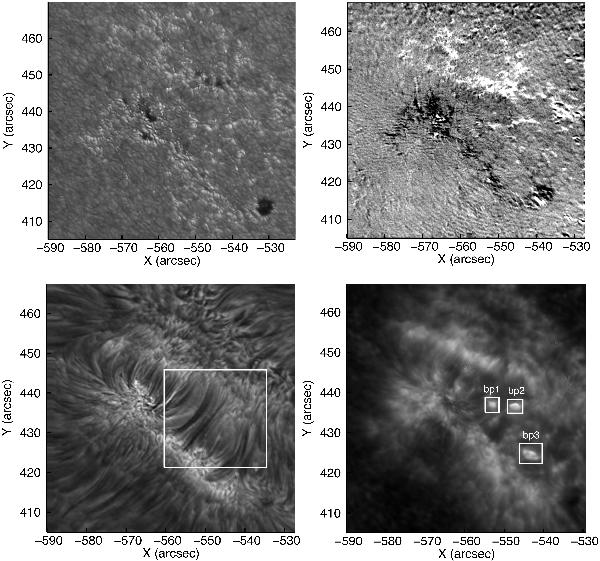
Simultaneous ROSA images of the G band (top left), line-of-sight magnetogram (top right), Hα core (bottom left), and Ca ii K core (bottom right). The magnetogram colour scale is in Gauss, where white indicates positive magnetic polarities, while black demonstrates polarities which are negative. Artificial saturation at ± 400 G is implemented to highlight regions of weak magnetic polarity on the solar surface. The white rectangle in the Hα core image indicates the approximate position where most of the jets are observed. White rectangles in the Ca ii K image, identified by “bp1”, “bp2”, and “bp3”, are the bright points selected for temporal analysis. Axes are in heliocentric arcseconds, where 1′′ ≈ 725 km.
Current usage metrics show cumulative count of Article Views (full-text article views including HTML views, PDF and ePub downloads, according to the available data) and Abstracts Views on Vision4Press platform.
Data correspond to usage on the plateform after 2015. The current usage metrics is available 48-96 hours after online publication and is updated daily on week days.
Initial download of the metrics may take a while.