Fig. 1
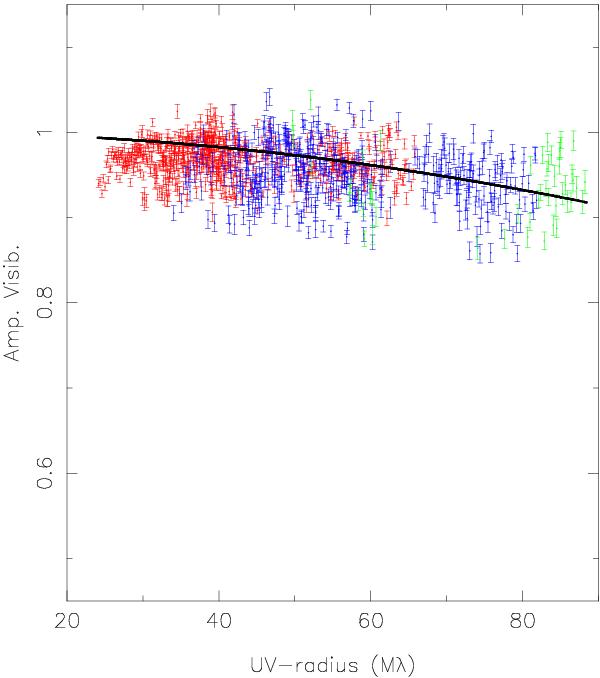
AMBER/VLTI squared visibility amplitudes of AB Dor A for J, H, and K bands (green, blue, and red data, respectively). The black continuous line corresponds to the visibilities resulting from the best fit of the data to a uniform disk model. The source is only partially resolved by the triplet A0-K0-G1, but sufficiently to constrain the angular size of AB Dor A to 0.62 ± 0.04 mas.
Current usage metrics show cumulative count of Article Views (full-text article views including HTML views, PDF and ePub downloads, according to the available data) and Abstracts Views on Vision4Press platform.
Data correspond to usage on the plateform after 2015. The current usage metrics is available 48-96 hours after online publication and is updated daily on week days.
Initial download of the metrics may take a while.