Fig. 1
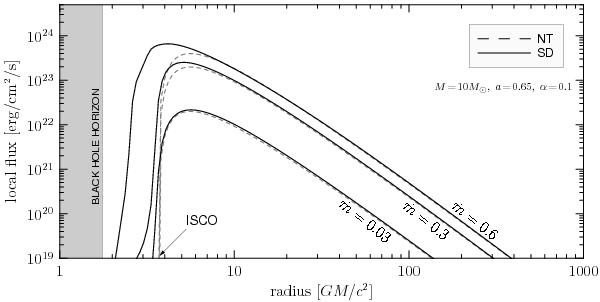
Examples of local (measured in the disk co-rotating frame) flux profiles emitted from the surface of a slim accretion disk (solid lines) and Novikov-Thorne disk (dashed lines) models. Flux profiles are shown for three different mass accretion rates Ṁ = 0.03, 0.3, 0.6 ṀEdd. Note the effects of advection, clearly visible in the slim-disk curves, which start to be important at ṁ ≳ 0.1.
Current usage metrics show cumulative count of Article Views (full-text article views including HTML views, PDF and ePub downloads, according to the available data) and Abstracts Views on Vision4Press platform.
Data correspond to usage on the plateform after 2015. The current usage metrics is available 48-96 hours after online publication and is updated daily on week days.
Initial download of the metrics may take a while.