Fig. 3
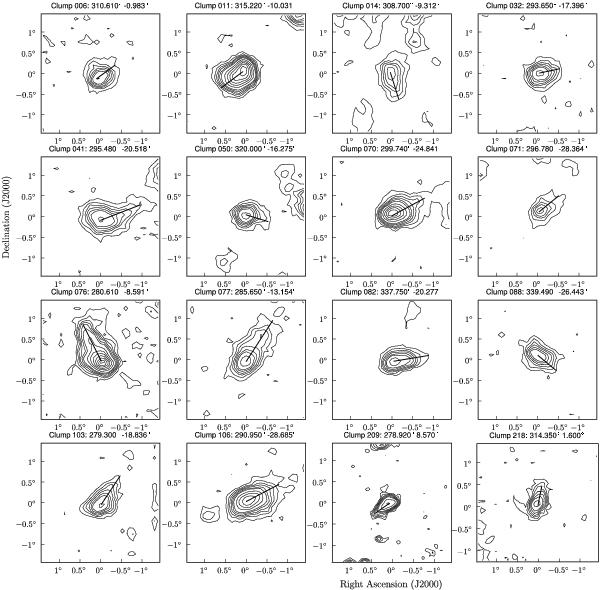
In total 33 of the isolated clumps show head-tail like morphologies. The figure shows column density maps of 16 of them (Clump 209 and 218 are EBHIS detections, the remaining clouds shown are from GASS data). The remaining 17 cannot as clearly be identified as HT structures in the column density maps, because nearby clumps partly overlap in the projection. They were confirmed to likely be HT clouds by a close inspection of the data cube. Contours are [3,6,9,12,16,20,30,40,...]·σrms with σrms = 5 × 1017 cm-2 (GASS) and σrms = 7 × 1017 cm-2 (EBHIS).
Current usage metrics show cumulative count of Article Views (full-text article views including HTML views, PDF and ePub downloads, according to the available data) and Abstracts Views on Vision4Press platform.
Data correspond to usage on the plateform after 2015. The current usage metrics is available 48-96 hours after online publication and is updated daily on week days.
Initial download of the metrics may take a while.