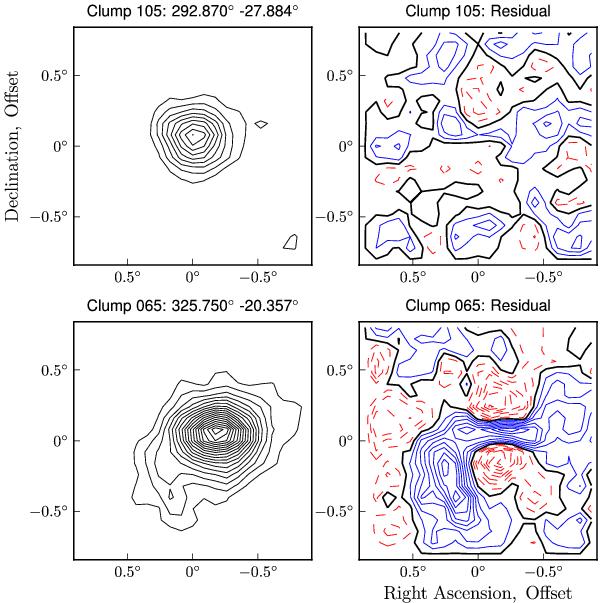
Fig. 16

For two isolated clumps a two-dimensional Gaussian was fitted to the column density profile (left panels). The residual (right panels) shows different behavior, for the upper row the noise level is very similar to an emission-free region in the surrounding, the lower row exhibits remaining features increasing the measured noise value. The residual RMS can be used as an estimator to the amount of substructure within a clump. Contour lines in the left panels start at 3σrms and have a spacing of 3σrms. Contour lines in the right panels are spaced with 1σrms, solid contours mark positive values, dashed contours are negative, the thick solid lines are zero flux.
Current usage metrics show cumulative count of Article Views (full-text article views including HTML views, PDF and ePub downloads, according to the available data) and Abstracts Views on Vision4Press platform.
Data correspond to usage on the plateform after 2015. The current usage metrics is available 48-96 hours after online publication and is updated daily on week days.
Initial download of the metrics may take a while.


