Fig. 14
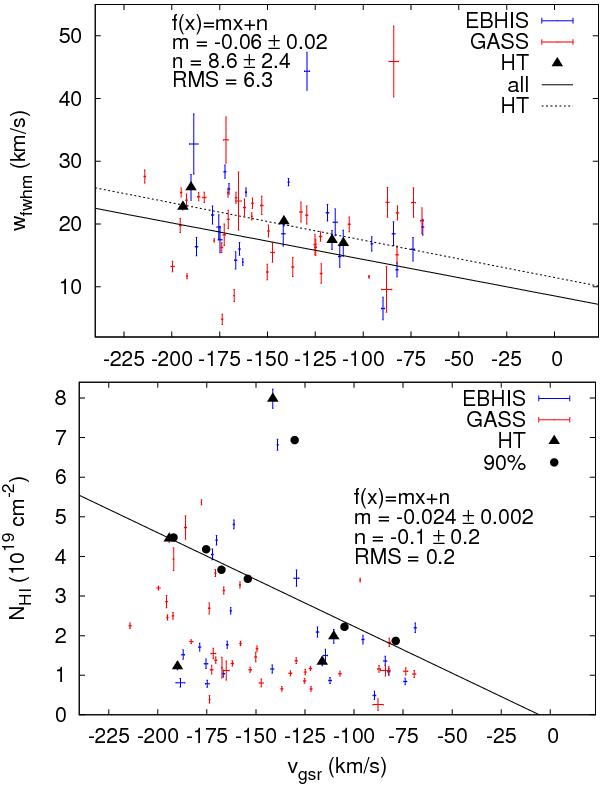
Line widths (upper panel) and column densities (lower panel) as a function of radial velocity for clumps along Stripe (a) as defined in Fig. 13. Head-tail clouds are marked with a triangle. For the line widths we computed a linear fit through all data points (solid line) and through HT clouds only (dotted line), respectively. For the column densities we calculated the 90% percentiles as in Fig. 12 to parameterize the upper envelope. The solid line is the best-fit linear relation of  vs. vgsr neglecting the outlier at vgsr ≈ −130 km s-1.
Current usage metrics show cumulative count of Article Views (full-text article views including HTML views, PDF and ePub downloads, according to the available data) and Abstracts Views on Vision4Press platform.
Data correspond to usage on the plateform after 2015. The current usage metrics is available 48-96 hours after online publication and is updated daily on week days.
Initial download of the metrics may take a while.