Fig. 1
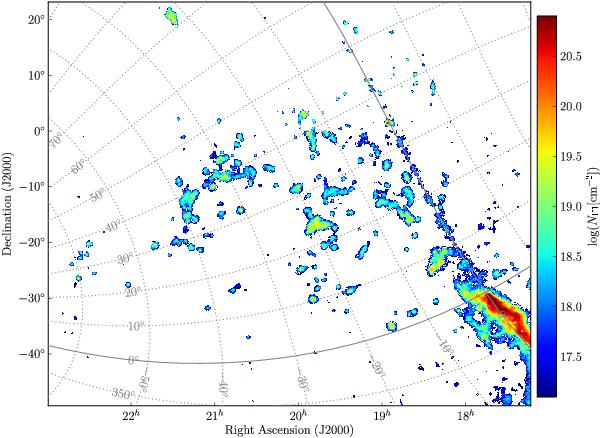
Column density map of HVC complex GCN. Spurious emission is visible along the MW plane that is caused by the increased noise level in this direction. The column densities were computed over the velocity interval vlsr = −360...−160 km s-1 using a mask to suppress image artifacts caused by noise. The mask was created using a hanning filtered data cube (hanning-9) and applying a 2.5σ threshold. The graticule shows Galactic coordinates.
Current usage metrics show cumulative count of Article Views (full-text article views including HTML views, PDF and ePub downloads, according to the available data) and Abstracts Views on Vision4Press platform.
Data correspond to usage on the plateform after 2015. The current usage metrics is available 48-96 hours after online publication and is updated daily on week days.
Initial download of the metrics may take a while.