Free Access
Fig. 2
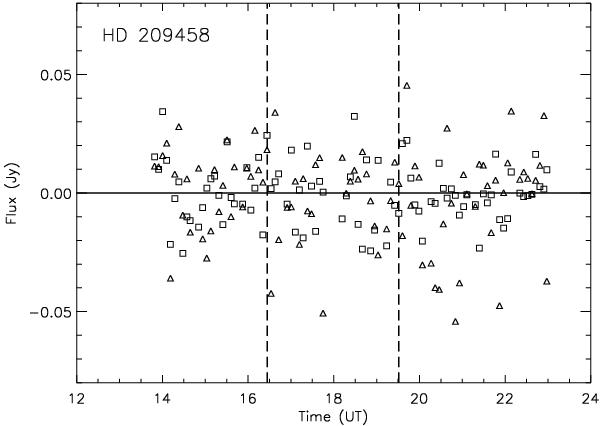
Time series of the flux density in the direction of HD 209458, for a sampling window of 339 s. The vertical dotted lines indicate the beginning and the end of the planet’s eclipse behind the host star. Triangles and squares correspond to the RR and LL polarizations, respectively.
Current usage metrics show cumulative count of Article Views (full-text article views including HTML views, PDF and ePub downloads, according to the available data) and Abstracts Views on Vision4Press platform.
Data correspond to usage on the plateform after 2015. The current usage metrics is available 48-96 hours after online publication and is updated daily on week days.
Initial download of the metrics may take a while.