Fig. 5
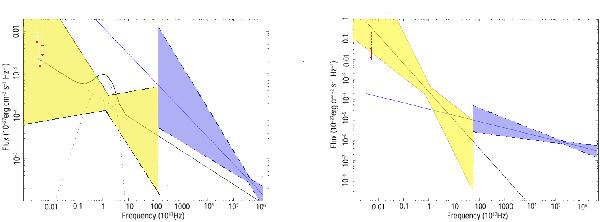
Upper limits on the extinction-corrected optical fluxes of PSR J1357−6429 (left) and PSR J1048−5832 (right) compared with the low-energy extrapolations of the X-ray (solid black) and γ-ray (solid blue) spectral models that best fit the XMM-Newton, Chandra (Esposito et al. 2007; Marelli et al. 2011), and Fermi (Lemoine-Goumard et al. 2011; Abdo et al. 2009) data. The plotted optical flux upper limits are corrected for interstellar extinction based upon the best-fit value of the NH. The dotted lines in the left panel correspond to the PL and BB components to the model X-ray spectrum. In both panels, the yellow and blue-shaded areas (left to right) indicate the 1σ uncertainty on the extrapolations of the X and γ-ray PLs, respectively. The vertical red dashed lines mark the uncertainty on the extinction-corrected optical flux upper limits, computed around the best-fit value of the NH. For PSR J1357−6429, we neglected the uncertainties on the extrapolation of the BB component, whose contribution in the optical band is negligible.
Current usage metrics show cumulative count of Article Views (full-text article views including HTML views, PDF and ePub downloads, according to the available data) and Abstracts Views on Vision4Press platform.
Data correspond to usage on the plateform after 2015. The current usage metrics is available 48-96 hours after online publication and is updated daily on week days.
Initial download of the metrics may take a while.