Fig. 3
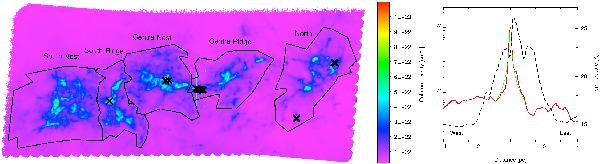
Left: column density map with sub-regions, as defined at an AV > 7 mag, overlaid. The 13 most massive sources with (S:N > 50) are denoted by a black cross. These sources have masses ranging from 20–60 M⊙. Right: column density (red) and temperature (dashed black) cut perpendicular to the densest part of the main filament (cyan lines on left image). The green curve is a power law fit NH2 ∝ r-0.8 which is consistent with a ρ(r) ∝ r-2 perpendicular to the filament.
Current usage metrics show cumulative count of Article Views (full-text article views including HTML views, PDF and ePub downloads, according to the available data) and Abstracts Views on Vision4Press platform.
Data correspond to usage on the plateform after 2015. The current usage metrics is available 48-96 hours after online publication and is updated daily on week days.
Initial download of the metrics may take a while.