Free Access
Fig. A.3
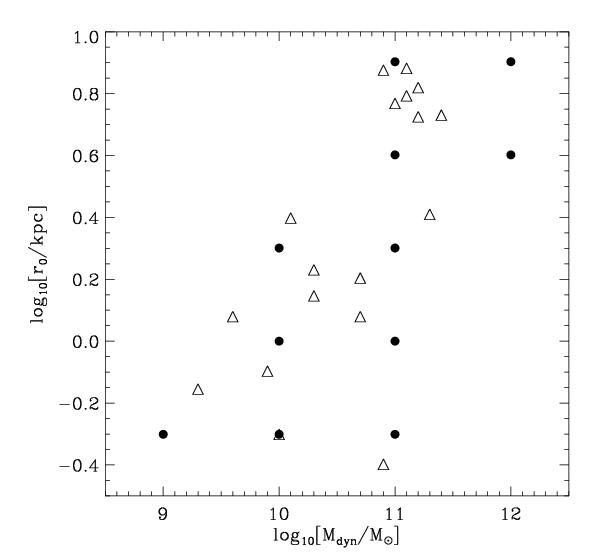
Distribution of dynamical masses and disk scale radii in the data sample and in the simulations. Open triangles: values observed in the data sample. Filled circles: values selected for the simulations.
Current usage metrics show cumulative count of Article Views (full-text article views including HTML views, PDF and ePub downloads, according to the available data) and Abstracts Views on Vision4Press platform.
Data correspond to usage on the plateform after 2015. The current usage metrics is available 48-96 hours after online publication and is updated daily on week days.
Initial download of the metrics may take a while.