Free Access
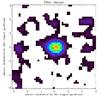
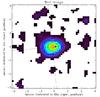
Fig. 3
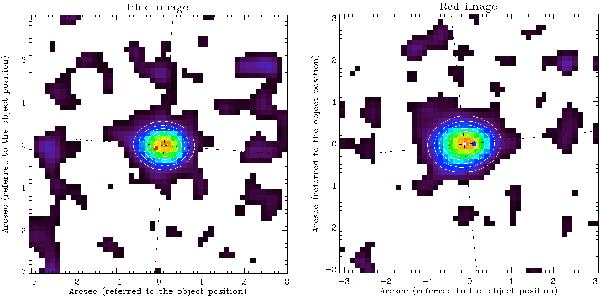
Example of the blue and red image for the same object of Fig. 2. White isophotes and black dashed lines represent the best model and axis orientation for the two dimensional gaussian function fitted to the images. The blue and red filled circles represent the position of the centroid of respectively the other image.
This figure is made of several images, please see below:
Current usage metrics show cumulative count of Article Views (full-text article views including HTML views, PDF and ePub downloads, according to the available data) and Abstracts Views on Vision4Press platform.
Data correspond to usage on the plateform after 2015. The current usage metrics is available 48-96 hours after online publication and is updated daily on week days.
Initial download of the metrics may take a while.