Fig. 2
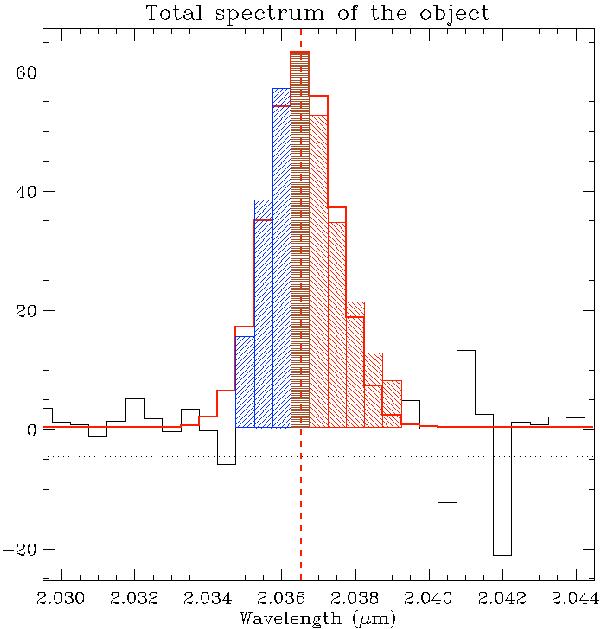
Example of the integrated spectrum for an object (SSA22a-C16). Overplotted is the fitted model of the line (red continuous line), the central wavelength (red dashed vertical line), the rms of residuals (two dotted horizontal lines) and the selected bins for the blue and red sides (respectively blue and red filled bins) and the central bin (brown filled bin).
Current usage metrics show cumulative count of Article Views (full-text article views including HTML views, PDF and ePub downloads, according to the available data) and Abstracts Views on Vision4Press platform.
Data correspond to usage on the plateform after 2015. The current usage metrics is available 48-96 hours after online publication and is updated daily on week days.
Initial download of the metrics may take a while.