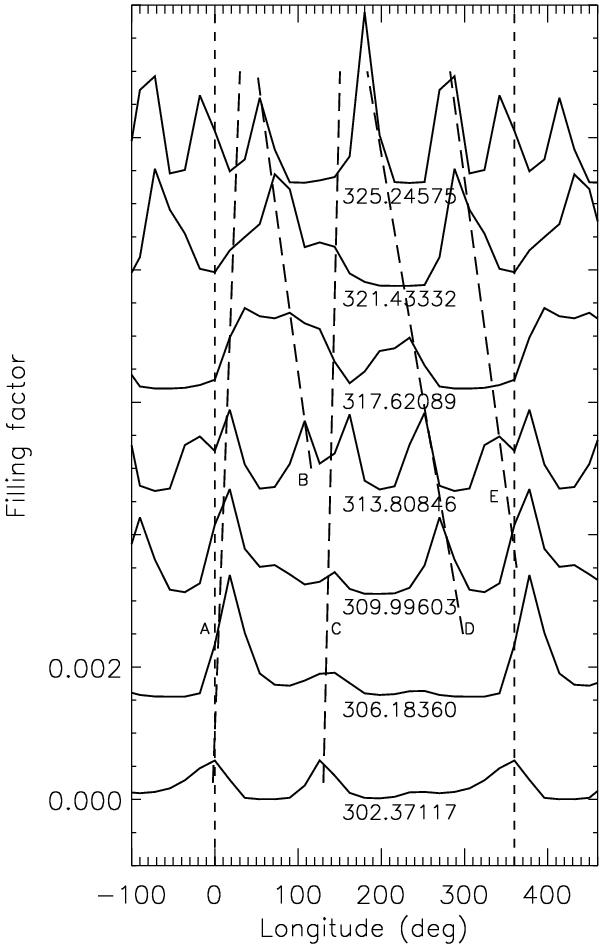
Fig. 4

The distributions of the spotted area vs. longitude at the labelled times (HJD−2 454 000.0) for Q = 0.0. The plots have been vertically shifted to show the migration of individual spots (relative maxima of the distributions) versus time. The vertical short-dashed lines mark longitudes 0° and 360°, beyond which the distributions have been repeated to help following the spot migration. The long-dashed lines labelled with capital letters from A to E trace the migration of the most conspicuous spots detected in the plots, respectively (see the text).
Current usage metrics show cumulative count of Article Views (full-text article views including HTML views, PDF and ePub downloads, according to the available data) and Abstracts Views on Vision4Press platform.
Data correspond to usage on the plateform after 2015. The current usage metrics is available 48-96 hours after online publication and is updated daily on week days.
Initial download of the metrics may take a while.


