Fig. 5
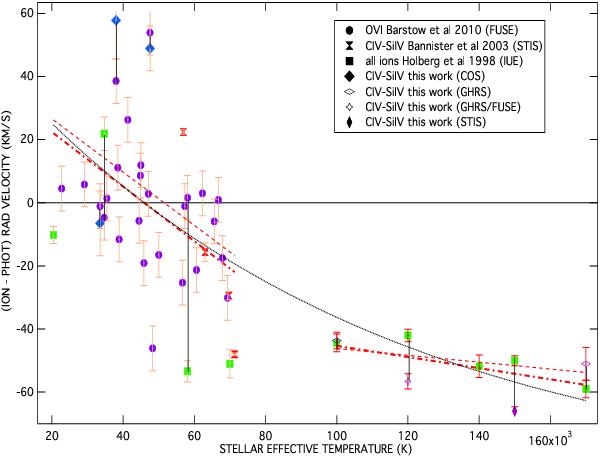
High ion velocity shifts with respect to Vphot as a function of the WD temperature: white dwarf FUSE, IUE and HST-STIS data from Holberg et al. (1998), Bannister et al. (2003) and Bar10 as well as the present COS data have been combined and for all high ion detections their velocity centroid is shown Bannisteras a function of the stellar effective temperature. In addition, HST and FUSE archive data have been analyzed for four of the five hottest stars, in order to provide a comparison with the IUE data. Temperatures are from Barstow et al. (1994, 2001, 2003, 2010), Christian et al. (1996), Finley et al. (1997), Holberg et al. (1999), Landsman et al. (1993), Marsh et al. (1997), Saffer et al. (1998), Vennes et al. (1997, 1998), Werner et al. (1997). Photospheric velocities are taken from the sources indicated in the legend, with the latest Bar10 results being chosen in case of multiple determinations. In case of measurements with two different instruments towards the same target, a vertical line links the two data points. Despite the large scatter, there is a clear decrease of the relative velocity with the stellar temperature. An arbitrary exponential fit to all data is shown (black dotted lines). Also shown are linear fits for T ≤ 75 000 K and T ≥ 75 000 K resp. Dotted lines are fits corresponding to the shown error bars. Dash-dotted lines are fits that use the overall dispersion as the mean error (see text). The temperature for which the average shift w.r.t the photospheric lines (resp. the star) is null is ≃50 000 K.
Current usage metrics show cumulative count of Article Views (full-text article views including HTML views, PDF and ePub downloads, according to the available data) and Abstracts Views on Vision4Press platform.
Data correspond to usage on the plateform after 2015. The current usage metrics is available 48-96 hours after online publication and is updated daily on week days.
Initial download of the metrics may take a while.