Free Access
Fig. 8
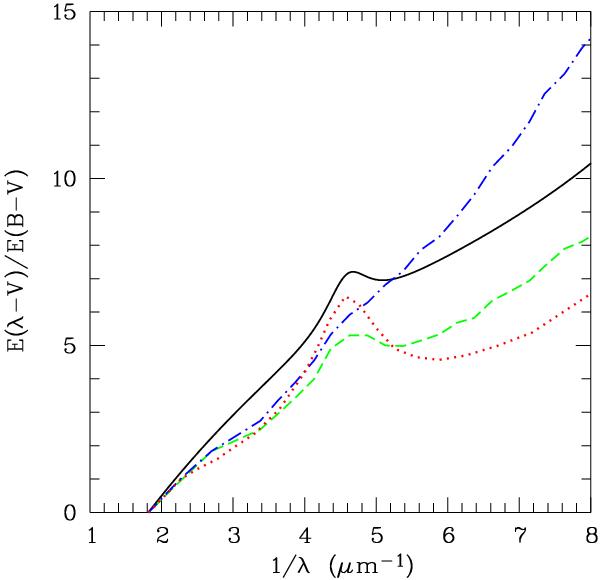
E(λ − V)/E(B − V). The mean curve found in this work is plotted as a thick line, together with the extinction curve of the MW (red dotted line) from Whittet (2003), LMC2 supershell (green short dashed line), and SMC (blue dot-dashed line) from Gordon et al. (2003).
Current usage metrics show cumulative count of Article Views (full-text article views including HTML views, PDF and ePub downloads, according to the available data) and Abstracts Views on Vision4Press platform.
Data correspond to usage on the plateform after 2015. The current usage metrics is available 48-96 hours after online publication and is updated daily on week days.
Initial download of the metrics may take a while.