Free Access
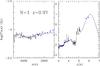
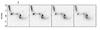
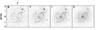
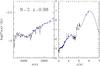
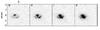
Fig. A.1
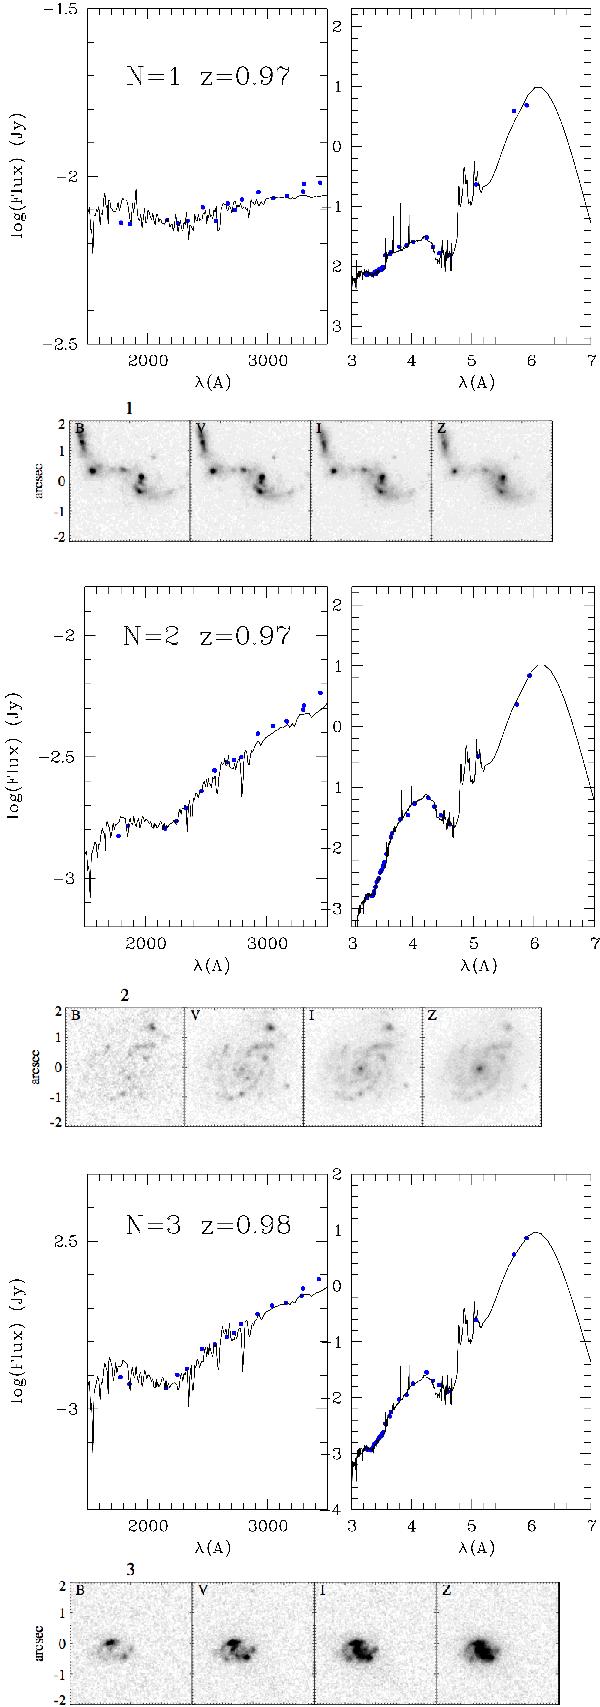
Spectral energy distributions for the full sample and HST images obtained from the GOODS cutout service V0.2. The best fit is represented with a solid line. The rest frame wavelength is plotted on the x-axis and the fluxes in Jy on the y-axis.
This figure is made of several images, please see below:
Current usage metrics show cumulative count of Article Views (full-text article views including HTML views, PDF and ePub downloads, according to the available data) and Abstracts Views on Vision4Press platform.
Data correspond to usage on the plateform after 2015. The current usage metrics is available 48-96 hours after online publication and is updated daily on week days.
Initial download of the metrics may take a while.